
Recent updates from the Federal Deposit Insurance Corporation (FDIC) have brought to light a concerning figure for the U.S. financial sector: 63 financial institutions are now under increased scrutiny, designated as “problem banks.” This development arrives amidst mixed signals from the economic landscape, creating uncertainty about the future stability of the banking industry. While only one bank has failed in 2024 so far, following five failures in 2023, the rise in problem banks warrants a closer examination. Despite robust earnings reported by the financial sector in the first quarter of the year, driven largely by cost-cutting and trading gains, the underlying picture may be more complex.
Economic indicators are currently presenting a puzzle. While manufacturing activity showed signs of slowing down recently, the services sector demonstrated expansion, creating a divergence that complicates economic forecasting. Adding to this complexity is the FDIC’s latest Quarterly Banking Profile, revealing that the number of banks on the Problem Bank List has climbed to 63 in Q1 2024. This list, maintained confidentially by the FDIC, identifies institutions exhibiting significant financial, operational, or managerial weaknesses that threaten their continued solvency. Although the FDIC does not publicly name these banks, it releases the aggregate number and assets of these institutions quarterly, offering valuable insights into the overall health of the banking system.
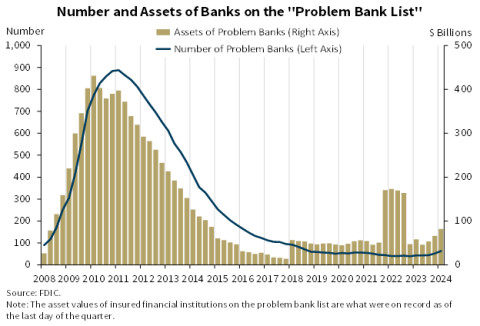 FDIC Problem Bank List: Number of Banks and Assets on the List. Chart showing the trend of US problem banks and their assets from Q1 2023 to Q1 2024.
Contextualizing the 63 Problem Banks
The figure of 63 U.S. banks on the FDIC’s Problem Bank List might initially appear alarming. It’s crucial, however, to place this number within a broader context. These 63 institutions represent a small fraction, just 1.4%, of the 4,568 banks currently monitored by the FDIC. This indicates that the vast majority of U.S. banks are currently considered financially sound by regulators.
Furthermore, the increase from 52 banks on the list in Q4 2023 to 63 in Q1 2024 represents a net addition of only 11 institutions. This incremental rise, while noteworthy, is not indicative of a sudden or dramatic surge in banking sector distress.
To further put this into perspective, consider historical bank failure rates. The most turbulent period for bank failures in recent U.S. history was the financial crisis of 2008-2009. During this period, from early 2008 through the end of 2011, a staggering 414 banks collapsed – averaging approximately 100 failures per year. Compared to this historical benchmark, the current situation, with 63 banks on the Problem Bank List and only one failure in 2024 to date, appears significantly less severe.
In 2024, only Republic First Bancorp (FRBK) has been taken over by regulators, marking the sole bank failure thus far. In 2023, five banks failed, including the high-profile case of Silicon Valley Bank (SIVBQ). These figures demonstrate that while bank failures do occur, they are not currently happening at a rate comparable to crisis periods.
Bank Failures: A Relatively Rare Occurrence
Over the past decade, bank failures in the United States have been infrequent. Since 2014, the highest number of bank failures in a single year was just 8, recorded in both 2015 and 2017. Against this backdrop, a hypothetical scenario of 63 bank failures would indeed constitute a substantial number and would undoubtedly amplify stress within the financial system.
However, it’s important to emphasize that placement on the Problem Bank List does not automatically предвещать bank failure. Many banks on this list are able to address their issues and improve their financial standing without collapsing. Moreover, current data from the financial sector suggests a degree of resilience. Financial companies have, in many respects, outperformed other market sectors in terms of earnings, at least for the first quarter of 2024.
Q1 Financial Sector Earnings: Strength with Caveats
Despite the addition of 11 banks to the Problem Bank List, the financial sector exhibited strong earnings performance in Q1 2024. Data from the Bureau of Economic Analysis (BEA) reveals a significant 16.1% increase in profits for financial companies domiciled in the U.S. in Q1, a substantial acceleration from the 1.3% increase in the previous quarter.
This performance contrasts sharply with the broader corporate sector. Nonfinancial companies experienced a 4.7% profit decline in Q1, a marked downturn compared to the 5.9% profit increase in the prior quarter. This divergence highlights a specific strength within the financial industry amidst a more general corporate slowdown.
Aggregating both financial and nonfinancial results, overall corporate profits in the U.S. decreased by approximately 0.6% quarter-over-quarter.
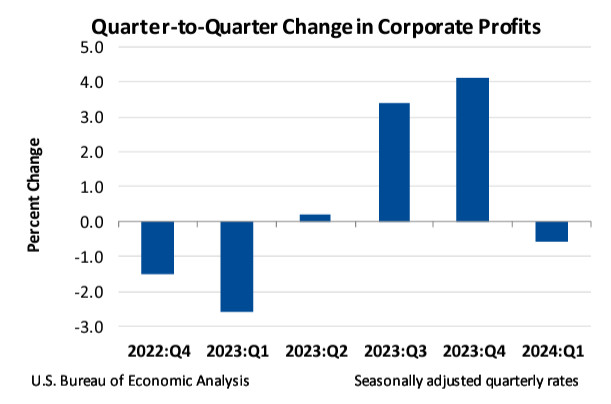 Quarter-over-Quarter Corporate Profit Change: Financial vs. Nonfinancial Companies. Bar chart comparing the profit changes in Q1 2024 for financial and nonfinancial sectors in the US.
The BEA’s data encompasses the entire corporate landscape, from small private businesses to large multinational corporations, providing a comprehensive view of earnings performance. It also adjusts for inventory valuation and capital consumption changes to offer a clearer picture of income from current production. This contrasts with more frequently cited S&P 500 earnings figures, which represent a narrower segment of the largest, publicly-traded companies. For instance, while overall corporate profits declined slightly, the S&P 500 saw a 5.9% profit increase in Q1 2024, according to FactSet. This divergence underscores the varied economic experiences across different tiers of the corporate world.
Crucially, the profitability surge in the financial sector wasn’t primarily driven by increased operational earnings. Instead, it appears to be largely attributable to cost-cutting measures and improved trading outcomes. BEA data indicates that operating costs in the financial sector decreased by $22.5 billion, while income from trading activities rose by $10.3 billion. This suggests that the Q1 earnings strength may not be solely indicative of fundamental improvements in the banking business model but could be influenced by temporary factors.
Key Considerations and Future Outlook
The current financial landscape presents a mixed and somewhat ambiguous picture. The cost savings and favorable trading results that boosted financial sector earnings in Q1 may not persist into Q2 and beyond. Predicting the future earnings trajectory of the financial sector remains challenging.
Furthermore, the broader decline in overall corporate earnings, as indicated by the BEA, is a concerning trend. If this trend continues, weakening corporate profitability could eventually impact the financial sector, creating new headwinds for banks.
Any tightening of financial conditions, including the possibility of a recession, would further strain the 63 institutions on the FDIC’s Problem Bank List. Investors and market participants should closely monitor the FDIC’s updates to this list in Q2 and subsequent quarters. An escalation in the number or severity of problem banks could represent a significant tail risk for financial markets.
To navigate market uncertainties and mitigate potential risks, including tail risks, resources like Options Jive on the tastylive financial network offer valuable insights and strategies for risk management. Staying informed and prepared is crucial in the current economic environment.
Andrew Prochnow brings extensive experience in global financial markets and options trading to his analysis. As a frequent contributor to Luckbox Magazine, his insights provide valuable perspectives for investors and traders navigating today’s complex financial landscape. For continuous market coverage, visit tastylive and their YouTube channels tastylive (options focused) and tastyliveTrending (stocks, futures, forex & macro). For enhanced trading tools and platform, explore opening an account with tastytrade.